Quick answer: The average U.S. home buys 10,356 kWh of electricity a year and needs roughly 19 panels — an 8.1 kW system covering about 399 sq ft of roof. But the average is nearly useless for your house: real usage runs from 503 kWh a month in California to 1,202 in Louisiana, which is the difference between 11 panels and 27. Find your kWh on a utility bill and size from that number, not your square footage.
Last verified: August 17, 2026. Electricity use: EIA Electric Sales, Revenue, and Average Price, Table 5.a (2024 data). Panel specs: Qcells datasheet. System pricing: EnergySage Marketplace (June 30, 2026).
The answer, by how much power you use
Panel count is one division problem: your annual kilowatt-hours, divided by what a panel makes where you live.
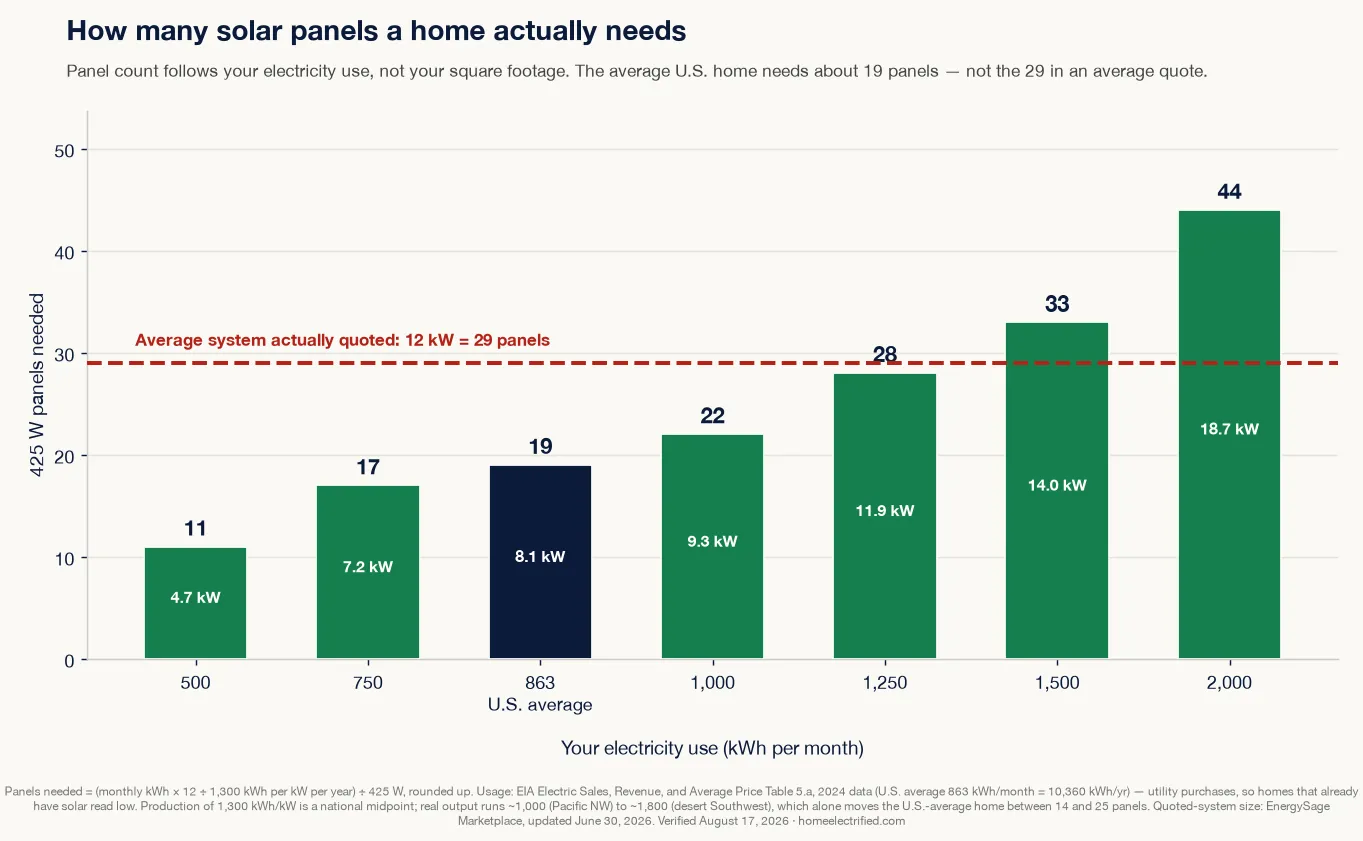
| Your use (kWh/month) | Per year | System size | 425 W panels |
|---|---|---|---|
| 500 | 6,000 | 4.7 kW | 11 |
| 750 | 9,000 | 7.2 kW | 17 |
| 863 (U.S. average) | 10,356 | 8.1 kW | 19 |
| 1,000 | 12,000 | 9.3 kW | 22 |
| 1,250 | 15,000 | 11.9 kW | 28 |
| 1,500 | 18,000 | 14.0 kW | 33 |
| 2,000 | 24,000 | 18.7 kW | 44 |
At 1,300 kWh per kW per year, the national midpoint. Counts round up to a whole panel.
Your kWh is on every utility bill, usually as a 12-month graph. Use the annual total if you can get it — a single month will mislead you badly, because a house in Phoenix uses three times more power in July than in March.
Why “for a 2,000 sq ft house” is the wrong question
It’s the most common way this gets asked, and it’s the one input that doesn’t work. Square footage tells you nothing reliable about electricity use, and the government’s own numbers show how far off it can put you.
Here’s the same question answered for two states, using EIA’s 2024 residential consumption data:
| Average use | Panels needed | |
|---|---|---|
| A home in Louisiana | 1,202 kWh/month | 27 |
| A home in California | 503 kWh/month | 11 |
Same square footage, 2.4× the electricity, 2.4× the panels. What actually drives the difference is climate and what your appliances burn: Louisiana runs air conditioning most of the year and heats with electricity; California has a mild coast, heats mostly with gas, and has the country’s strictest appliance and building efficiency standards.
Within a single state the spread between two neighbours is nearly as wide. A gas furnace, gas water heater and gas range put a house at the bottom of the range. Electric heat, an EV and a pool pump put it at the top. Square footage is a rounding error next to that.
What one panel actually makes
A panel’s wattage rating is its output under lab test conditions — full midday sun, 25°C. It’s a nameplate, not a promise. What matters is annual production, which is the rating multiplied by how many useful sun-hours your location gets:
| Panel | At 1,000 kWh/kW (Pacific NW) | At 1,300 (national midpoint) | At 1,800 (desert SW) |
|---|---|---|---|
| 400 W | 400 kWh/yr | 520 kWh/yr | 720 kWh/yr |
| 425 W | 425 kWh/yr | 553 kWh/yr | 765 kWh/yr |
| 440 W | 440 kWh/yr | 572 kWh/yr | 792 kWh/yr |
Today’s residential panels cluster in the 400–450 W band — Qcells’ Q.TRON BLK M-G2+ line, a mainstream residential choice, spans 415–440 W in a 67.8 × 44.6 inch module.
Read that table sideways and you get the point most sizing guides bury: where you live changes the answer more than which panel you buy. Going from a 400 W to a 440 W panel changes output 10%. Moving the same panel from Seattle to Phoenix changes it 80%. Panel shopping is the small lever; the location was decided when you bought the house.
For the U.S.-average home, that geography alone swings the count from 14 panels to 25:
| Location | Production | Panels for 10,356 kWh/yr |
|---|---|---|
| Pacific Northwest, Northeast | 1,000 kWh/kW | 25 |
| National midpoint | 1,300 kWh/kW | 19 |
| Desert Southwest | 1,800 kWh/kW | 14 |
This is why every honest solar page tells you to run NREL’s PVWatts on your actual address. It’s free, it takes two minutes, and it uses real weather-station data for your location instead of a national average that fits almost nobody.
The gap between what you need and what you’ll be quoted
Put our two datasets next to each other and something worth knowing falls out.
The average U.S. home needs about 8.1 kW. The average system quoted on the EnergySage Marketplace is 12 kW — about 29 panels at 425 W. That’s roughly 50% more system than average usage implies.
Some of that gap is legitimate, and it’s worth understanding before you decide you’re being oversold:
- Solar shoppers aren’t average. People who buy solar skew toward larger homes, higher bills and single-family ownership. The EIA average includes apartments and small rentals that will never host a rooftop system.
- You’re sizing for the future, not last year. An EV, a heat pump or a hot tub arriving in year three needs to be in the system now — retrofitting panels later means a second permit, a second truck roll, and possibly a new inverter.
- Bigger systems are cheaper per watt. Our cost breakdown puts a 6 kW system at $2.68/W against $2.56/W at 12 kW, because permits, design and labour barely change with size.
And some of it isn’t legitimate. A commissioned salesperson is paid on system size, and “cover 100% of your usage” is an easy story to tell someone who hasn’t checked what their usage is. The defence is simply knowing your own number before the conversation starts.
The question to ask any quote: what annual kWh figure did you size this to, and where did it come from? If the answer isn’t your actual 12-month usage, the system wasn’t sized for your house.
Sizing for an EV or a heat pump
If you’re electrifying other things, add their load before sizing — this is the single most common reason a system that looked right turns out too small.
An EV driven 13,500 miles a year at 3.5 mi/kWh, with 10% charging losses, uses about 4,243 kWh a year. That’s 3.3 kW, or about eight extra 425 W panels — a meaningful addition to a 19-panel system, and a strong argument for sizing up front. Our EV home charging guide has the per-state cost math if you want to check the load against your own driving.
A heat pump is harder to pin to one number, because its consumption depends on your climate, your home’s envelope and what you’re replacing. A mild-climate home swapping out electric resistance heat may use less electricity afterward; a cold-climate home coming off gas will use considerably more. Size that one from a real load estimate rather than a rule of thumb — the same trap we cover in what size heat pump do I need, where the popular rule misses by 15–50%.
Will they fit on your roof?
A 19-panel system is about 399 sq ft of panel — 21.0 sq ft each. Most single-family roofs have that much surface. Fewer have that much usable surface:
- Only some faces count. South-facing is best in the U.S.; east and west work at roughly 15–20% less output; north-facing is rarely worth it.
- Setbacks and walkways are code. Fire codes in most jurisdictions require clear paths along ridges and edges, which can remove a surprising amount of an otherwise good roof.
- Obstructions fragment the space. Vents, chimneys, skylights and dormers break a roof plane into pieces too small for full rows.
- Shade is disqualifying, not just costly. A tree that shades one panel for part of the afternoon drags down more than that panel alone, depending on how the system is wired.
Between those, plan for roughly 20–30% more roof area than raw panel area — call it 480–520 sq ft for a 19-panel system. If your usable roof can’t fit what your usage calls for, the practical answers are higher-efficiency panels in the same footprint, or accepting partial offset. Covering 70% of your bill is still a good outcome; the last 30% is usually the least economical part of any system anyway, especially where exported power earns less than the retail rate.
Work out your own number
How Many Solar Panels Do I Need?
Pick your state to load its real average electricity use (EIA, 2024 data), or type your own from a utility bill. Every field is editable.
Panel count is rounded up to a whole panel, so coverage usually lands slightly over 100%. Production varies enormously by location — roughly 1,000–1,200 kWh per kW in the Pacific Northwest and Northeast, 1,300–1,450 in the Southeast, up to about 1,800 in the desert Southwest — so run your address through NREL PVWatts and put the real number in. Roof area is panel area only(21.0 sq ft each, Qcells Q.TRON BLK M-G2+, 67.8 × 44.6 in); installers plan roughly 20–30% more for row spacing, edge setbacks and fire-code walkways, and only unshaded roof faces count. Usage: EIA Electric Sales, Revenue, and Average Price Table 5.a (2024 data), retrieved August 17, 2026 — these are utility purchases, so homes that already have solar show lower than they use. EV figure: 13,500 mi/yr at 3.5 mi/kWh with 10% charging losses. Pricing: EnergySage Marketplace (June 30, 2026). Section 25D expired for installations completed after December 31, 2025, so no federal credit is applied. Estimates only, not a quote.
Panels needed by state, on real usage data
Every state’s average household, from EIA’s 2024 figures, converted to a panel count. Sorted alphabetically; find yours, then adjust for your own bill.
| State | kWh/month | kWh/year | System size | 425 W panels |
|---|---|---|---|---|
| Alabama | 1,143 | 13,716 | 10.6 kW | 25 |
| Alaska | 578 | 6,936 | 5.5 kW | 13 |
| Arizona | 1,075 | 12,900 | 10.2 kW | 24 |
| Arkansas | 1,048 | 12,576 | 9.8 kW | 23 |
| California | 503 | 6,036 | 4.7 kW | 11 |
| Colorado | 674 | 8,088 | 6.4 kW | 15 |
| Connecticut | 695 | 8,340 | 6.8 kW | 16 |
| Delaware | 911 | 10,932 | 8.5 kW | 20 |
| District of Columbia | 639 | 7,668 | 6.0 kW | 14 |
| Florida | 1,104 | 13,248 | 10.2 kW | 24 |
| Georgia | 1,074 | 12,888 | 10.2 kW | 24 |
| Hawaii | 495 | 5,940 | 4.7 kW | 11 |
| Idaho | 944 | 11,328 | 8.9 kW | 21 |
| Illinois | 693 | 8,316 | 6.8 kW | 16 |
| Indiana | 901 | 10,812 | 8.5 kW | 20 |
| Iowa | 832 | 9,984 | 8.1 kW | 19 |
| Kansas | 876 | 10,512 | 8.5 kW | 20 |
| Kentucky | 1,046 | 12,552 | 9.8 kW | 23 |
| Louisiana | 1,202 | 14,424 | 11.5 kW | 27 |
| Maine | 550 | 6,600 | 5.1 kW | 12 |
| Maryland | 929 | 11,148 | 8.9 kW | 21 |
| Massachusetts | 570 | 6,840 | 5.5 kW | 13 |
| Michigan | 618 | 7,416 | 6.0 kW | 14 |
| Minnesota | 712 | 8,544 | 6.8 kW | 16 |
| Mississippi | 1,156 | 13,872 | 11.1 kW | 26 |
| Missouri | 1,001 | 12,012 | 9.3 kW | 22 |
| Montana | 852 | 10,224 | 8.1 kW | 19 |
| Nebraska | 956 | 11,472 | 8.9 kW | 21 |
| Nevada | 930 | 11,160 | 8.9 kW | 21 |
| New Hampshire | 619 | 7,428 | 6.0 kW | 14 |
| New Jersey | 662 | 7,944 | 6.4 kW | 15 |
| New Mexico | 654 | 7,848 | 6.4 kW | 15 |
| New York | 571 | 6,852 | 5.5 kW | 13 |
| North Carolina | 1,015 | 12,180 | 9.8 kW | 23 |
| North Dakota | 1,029 | 12,348 | 9.8 kW | 23 |
| Ohio | 846 | 10,152 | 8.1 kW | 19 |
| Oklahoma | 1,079 | 12,948 | 10.2 kW | 24 |
| Oregon | 882 | 10,584 | 8.5 kW | 20 |
| Pennsylvania | 817 | 9,804 | 7.7 kW | 18 |
| Rhode Island | 567 | 6,804 | 5.5 kW | 13 |
| South Carolina | 1,050 | 12,600 | 9.8 kW | 23 |
| South Dakota | 994 | 11,928 | 9.3 kW | 22 |
| Tennessee | 1,154 | 13,848 | 11.1 kW | 26 |
| Texas | 1,096 | 13,152 | 10.2 kW | 24 |
| Utah | 774 | 9,288 | 7.2 kW | 17 |
| Vermont | 574 | 6,888 | 5.5 kW | 13 |
| Virginia | 1,032 | 12,384 | 9.8 kW | 23 |
| Washington | 956 | 11,472 | 8.9 kW | 21 |
| West Virginia | 1,027 | 12,324 | 9.8 kW | 23 |
| Wisconsin | 645 | 7,740 | 6.4 kW | 15 |
| Wyoming | 863 | 10,356 | 8.1 kW | 19 |
| U.S. average | 863 | 10,356 | 8.1 kW | 19 |
Read this table for the usage, not the final count. Every row uses the same national production midpoint of 1,300 kWh per kW, which isolates one variable — how much power that state’s households actually buy. Real production varies by state too, and it partly cancels: sunny Louisiana and Arizona will beat 1,300 and need fewer panels than shown, while Maine and Washington will fall short of it and need more. The usage column is hard data; the panel column is that data run through one national assumption.
Two caveats on the EIA figures themselves. They measure electricity purchased from the utility, so households that already have solar show up lower than they actually consume — which is part of why Hawaii and California sit at the bottom. And they’re averages across every residential account in the state, apartments included.
Methodology & sources
Verified August 17, 2026:
- Electricity use: U.S. Energy Information Administration, Electric Sales, Revenue, and Average Price, Table 5.a — average monthly residential consumption by state, 2024 data (released October 7, 2025), retrieved August 17, 2026. U.S. average 863 kWh/month across 143.1 million residential customers. These are utility sales, not total household consumption; homes with rooftop solar consume more than they purchase.
- Production assumption: 1,300 kWh per kW per year as a national midpoint, the same figure used across our solar cost, payback, and payback-by-state pages. It derives transparently: peak sun-hours × 365 × 0.85 system derate gives 1,086 kWh/kW at 3.5 sun-hours and 1,706 at 5.5, so 1,300 corresponds to about 4.2 sun-hours. Use NREL PVWatts for your address — a site-specific figure beats any national average.
- Panel specifications: Qcells Q.TRON BLK M-G2+, 415–440 W, 67.8 × 44.6 in (1,722 × 1,133 mm) = 21.0 sq ft, efficiency up to 22.5%. We use 425 W as the default because it sits mid-range for current residential modules. Published per-panel area figures vary from about 21 to 25 sq ft; the higher numbers include row spacing rather than the module itself, which is why we quote the datasheet dimension and handle spacing separately.
- Panel count = annual kWh ÷ production per kW ÷ panel wattage, rounded up to a whole panel. Rounding up is why coverage lands slightly over 100%.
- EV load: 13,500 miles a year (FHWA driver average) ÷ 3.5 mi/kWh × 1.10 for Level 2 charging losses = 4,243 kWh/year — the standard assumption set used across our EV charging pages.
- Quoted-system size: 12 kW average quoted system and $2.56–$2.68/W by size, EnergySage Marketplace (updated June 30, 2026).
- What we did not do: we wanted a per-state production figure to pair with the per-state usage data, which would make the state table exact rather than usage-only. NREL’s PVWatts API was not reachable from our environment during this session, and we won’t publish per-state production numbers sourced from third-party roundups. The table therefore isolates usage and says so, and the calculator lets you set production yourself.
- Figures are planning estimates, not quotes. Any installer should size from your own 12-month usage history — ask to see the number they used.
Consumption data and panel specifications change; this page is re-verified on a schedule and the “verified” date reflects the latest check.
Frequently asked questions
How many solar panels does the average house need?
About 19 panels. The average U.S. home buys 863 kWh of electricity a month, or 10,356 kWh a year (EIA, 2024 data). At a national-midpoint production of 1,300 kWh per kW and 425 W panels, that's an 8.1 kW system — roughly 19 panels covering about 399 sq ft of roof.
How many solar panels do I need for a 2,000 sq ft house?
Square footage doesn't determine it — electricity use does. Two identical 2,000 sq ft homes need very different systems: a Louisiana household averages 1,202 kWh a month and needs about 27 panels, while a California one averages 503 kWh and needs about 11. Find your kWh on a utility bill and size from that.
How much electricity does one solar panel produce?
A 425 W panel produces roughly 553 kWh a year at the U.S. midpoint of 1,300 kWh per kW installed — about 1.5 kWh on an average day. That swings from around 425 kWh in the cloudy Pacific Northwest to 765 kWh in the desert Southwest for the identical panel.
How many solar panels do I need to charge an electric car?
About 8 more. Driving 13,500 miles a year at 3.5 mi/kWh, with 10% charging losses, uses roughly 4,243 kWh — which needs about 3.3 kW, or eight 425 W panels, on top of whatever your house already uses.
How much roof space do I need for solar panels?
About 21 sq ft per panel, so roughly 399 sq ft for a typical 19-panel system. That's panel area alone — installers plan 20–30% more for row spacing, edge setbacks and fire-code walkways, and only unshaded roof faces count toward it.
How many kWh does a 400 watt solar panel produce per day?
Roughly 1.4 kWh a day on average across a year, or about 520 kWh annually at 1,300 kWh per kW. Daily output is not steady — a clear June day might produce three times what an overcast December day does, which is why solar is sized on annual totals rather than daily ones.