Quick answer: Home solar averages about $2.60 per watt installed, which is roughly $16,080 for a 6 kW system and $30,720 for a 12 kW system — the national average quoted system is 12 kW at about $31,135 before incentives. The big change this year: the 30% federal tax credit expired December 31, 2025. Sticker prices barely moved, but your out-of-pocket cost jumped $4,800–$9,200, pushing typical payback from 8.7 years to 12.5 years at the registered $2.60/W.
Last verified: August 2, 2026. Installed prices: EnergySage Marketplace (updated June 30, 2026). Electricity rate: EIA Electric Power Monthly (July 2026; re-verified October 10, 2026). Credit status: OBBBA / IRS.
What solar costs right now
Solar is priced per watt of system capacity, and bigger systems cost less per watt — the truck roll, permits, and design work are roughly the same whether you install 6 kW or 12 kW:
| System size | Price per watt | Installed cost | Roughly enough for |
|---|---|---|---|
| 6 kW | $2.68/W | $16,080 | A small or efficient home |
| 8 kW | $2.62/W | $20,960 | A typical 1,500–2,000 sq ft home |
| 10 kW | $2.58/W | $25,800 | A larger home, or one adding an EV |
| 12 kW | $2.56/W | $30,720 | The national average quoted system |
These are EnergySage Marketplace averages — quotes from installers competing against each other. That competition matters enormously, which brings us to the number most cost guides skip.
The $1-per-watt gap nobody mentions
Marketplace quotes average $2.60/W. But Lawrence Berkeley National Laboratory’s tracking of actual installed prices put the 2024 median cash purchase at about $3.50/W — nearly a dollar per watt higher.
On a 12 kW system that gap is worth roughly $11,000. It is, more or less, the difference between shopping competitively and signing with the first company that knocks on your door. Solar has unusually high customer-acquisition costs baked into door-to-door sales, and you pay them.
The single highest-value thing you can do about solar pricing is get three quotes. Not because installers are dishonest, but because the spread on identical hardware is genuinely that wide.
What the expired credit did to your bill
Section 25D covered 30% of the total system cost, uncapped, for systems you owned. It expired for installations completed after December 31, 2025. Here’s what that removal costs, by system size:
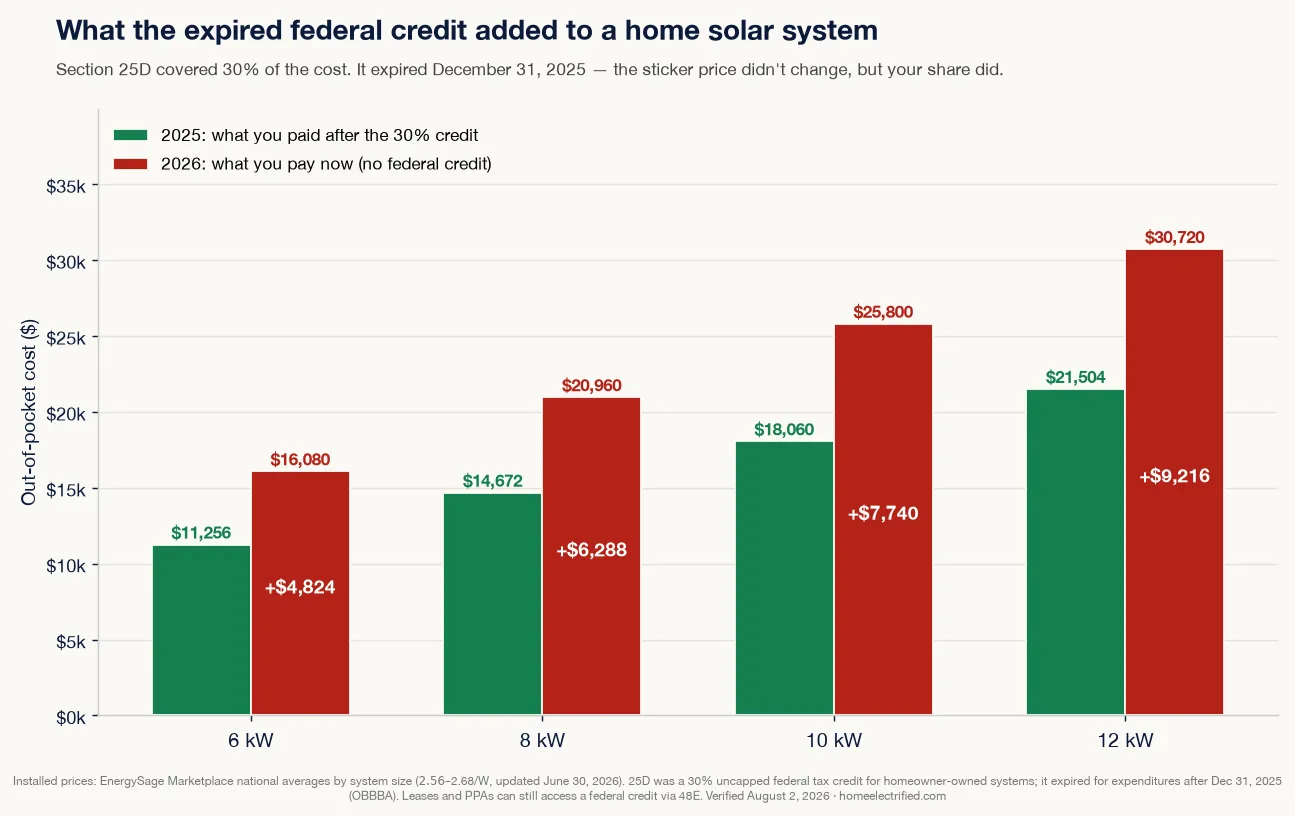
| System | Sticker price | 2025 out-of-pocket (after 30% credit) | 2026 out-of-pocket | What the expiry added |
|---|---|---|---|---|
| 6 kW | $16,080 | $11,256 | $16,080 | +$4,824 |
| 8 kW | $20,960 | $14,672 | $20,960 | +$6,288 |
| 10 kW | $25,800 | $18,060 | $25,800 | +$7,740 |
| 12 kW | $30,720 | $21,504 | $30,720 | +$9,216 |
Worth being precise about what happened: solar didn’t get more expensive — it stopped being subsidised. Installers’ prices are roughly flat year over year. The entire increase is the credit disappearing.
What’s left in 2026
The federal residential credit is gone, but not everything is:
- Leases and PPAs still carry a federal credit. Third-party-owned systems can claim the 48E commercial credit — but the window is closing: projects that began construction by July 4, 2026 have a four-year safe harbor, and anything starting after that must be placed in service by December 31, 2027. The catch: the leasing company claims it, not you. You see it as a lower monthly payment, and you give up ownership and most of the long-term savings. We walk through the details in is there a solar tax credit in 2026, and put all four ways of paying side by side over 25 years in lease vs buy vs PPA — where a typical dealer-fee loan turns out to cost more than most leases.
- State credits and rebates remain in many places — New York and Arizona run state tax credits, and several states have meaningful utility rebates.
- SREC markets (Massachusetts, Illinois, New Jersey, Maryland, D.C.) pay you per megawatt-hour generated, sometimes for 10–15 years. In a strong SREC state this can rival what the federal credit was worth.
- Property and sales tax exemptions are common and easy to miss — many states don’t add solar to your assessed property value, and some waive sales tax on the equipment.
- Net metering is the quiet one that matters most. What your utility pays for exported power often affects lifetime economics more than any rebate. Check your utility’s current rules before you size a system.
Payback: the honest math
Payback is not sticker ÷ year-one savings. Panels lose about 0.5% of output a year, and you typically use about 90% of what you make. Walked year by year at the U.S. average residential rate of 18.31¢/kWh, for a 12 kW system at the registered $2.60/W ($31,200):
- Year-1 production = 12 × 1,300 = 15,600 kWh
- Year-1 savings = 15,600 × 90% × $0.1831 = $2,571
- Crossover with degradation = 12.5 years
- The same system in 2025, at $21,840 after the 30% credit, paid back in 8.7 years
So the credit’s expiry added just under four years to payback. A 12.5-year payback on a 25-year asset still leaves about 13 years of nearly free electricity. The 51-state table is this same model in every jurisdiction.
Two things move this number more than anything else:
- Your electricity rate. Payback scales almost linearly with it. At Hawaii’s 48.00¢/kWh the same system pays back in 4.7 years; at Louisiana’s 12.72¢ it takes 18.3. The full ranking is in solar payback period by state.
- Your sun hours. Production ranges from roughly 1,000 kWh per kW in the Pacific Northwest to about 1,800 in the desert Southwest. Run your address through NREL’s free PVWatts tool for a real number rather than a national average.
What actually drives your quote
- System size — the dominant factor, and it’s set by your electricity usage, not your home’s square footage. Work out yours in how many solar panels do I need; the average home’s usage implies about 8 kW, well under the 12 kW average quote.
- Roof complexity — steep pitches, multiple planes, tile or slate, and shading all add labor and cut production.
- Equipment tier — premium panels and microinverters cost more per watt; the panel itself is only about $0.30–$0.70 of the installed price. Most of what you pay is inverter, racking, labor, permits, and sales overhead.
- Electrical work — an older service panel may need upgrading before it can accept solar, which is a real and frequently under-quoted line item. It’s the same gating problem EV owners hit: our electrical panel upgrade cost guide breaks down what the upgrade actually costs and how it changes solar payback.
- Your state’s permitting — soft costs vary widely by jurisdiction and show up in your price.
Should you still do it?
The unsatisfying but accurate answer: it depends far more on your utility rate than on anything about the panels.
The case is still strong if you’re in a high-rate state (California, the Northeast, Hawaii), you have good sun and an unshaded south-facing roof, you plan to stay 10+ years, and your utility still offers favorable net metering.
The case got genuinely harder if electricity where you live is cheap, your roof is shaded or complex, your utility has moved to low export rates, or you might move within a few years.
What hasn’t changed: solar is a hedge against electricity prices, which rose about 5% nationally in the past year alone (EIA: 17.45¢ in July 2025 to 18.31¢ in July 2026). You’re pre-buying 25 years of power at today’s price. That argument survives the credit’s expiry — it’s just no longer subsidised by 30%.
If you’re weighing solar alongside other electrification projects, the same “is it worth it after the credits expired” question now applies to heating too — see heat pump rebates in 2026, where 25C went the same way as 25D.
Methodology & sources
Verified August 2, 2026:
- Installed prices: EnergySage Marketplace national data — $2.60/W average, 12 kW average quoted system, $31,135 average total before incentives; by-size figures $2.68/W (6 kW) to $2.56/W (12 kW). Page updated June 30, 2026 from marketplace quote data.
- The marketplace-vs-market gap: Lawrence Berkeley National Laboratory’s installed-price tracking, 2024 median cash purchase ~$3.50/W (October 2025 report), compared against EnergySage marketplace quotes.
- Credit status: Section 25D (30%, uncapped, homeowner-owned) expired for installations completed after December 31, 2025 under the One Big Beautiful Bill Act. Third-party-owned systems may still access 48E — construction start by July 4, 2026 earns a four-year safe harbor; later starts must be placed in service by December 31, 2027.
- Electricity rate: EIA Electric Power Monthly, Table 5.6.A, U.S. average residential 18.31¢/kWh (July 2026 data, retrieved October 10, 2026).
- Production assumption: 1,300 kWh per kW per year as a national midpoint. Sources disagree on a single national figure, so we derive it transparently: peak sun-hours × 365 × 0.85 system derate gives 1,086 kWh/kW at 3.5 sun-hours and 1,706 at 5.5 — 1,300 corresponds to about 4.2 sun-hours. Use NREL PVWatts for your address; site-specific estimates beat any national average.
- Payback = installed cost ÷ (annual production × electricity rate). It ignores rate inflation (which shortens payback), panel degradation of about 0.5%/year, and any maintenance or inverter replacement (which lengthen it).
- Figures are planning estimates, not quotes. Get three competing quotes before signing anything.
Solar pricing and incentives change; this page is re-verified on a schedule and the “verified” date reflects the latest check.
Frequently asked questions
How much do solar panels cost in 2026?
About $2.60 per watt installed on the EnergySage Marketplace, so roughly $16,080 for a 6 kW system and $30,720 for a 12 kW system before incentives. The national average quoted system is 12 kW at about $31,135. Quotes from a single door-knocking installer often run closer to $3.50/watt.
Is there still a federal solar tax credit in 2026?
Not for systems you buy yourself. The 30% Section 25D residential credit expired for installations completed after December 31, 2025. A federal credit does still exist for third-party-owned systems (lease or PPA) through the 48E business credit, but the leasing company claims it and its deadlines have tightened — you see it only indirectly in your payment.
How much did the expired credit add to the cost of solar?
Between about $4,800 and $9,200 depending on system size. A 12 kW system that cost $21,504 out of pocket in 2025 after the 30% credit now costs the full $30,720 — an increase of $9,216. The sticker price didn't change; your share of it did.
What is the payback period for solar in 2026?
12.5 years at the U.S. average electricity rate of 18.31¢/kWh, for a 12 kW system at $2.60/watt with no federal credit — 90% self-use and 0.5%/year degradation, the same model as the calculator. It was 8.7 years while the 30% credit existed. Payback is much faster in expensive-electricity states like California and Hawaii and much slower where power is cheap.
How many solar panels do I need for a house?
The average quoted U.S. system is 12 kW, which is roughly 27–30 modern panels at 400–450 watts each. Your actual number depends on your electricity use, roof space, and local sun hours — not on your home's square footage.
Is solar still worth it without the tax credit?
It depends heavily on your electricity rate. Losing 30% pushed typical payback from 8.7 years to 12.5 years, which is still well inside a system's 25-year-plus life. Where power is expensive the case is still strong; where it's cheap, the math got noticeably harder.