Quick answer: After the federal credit expired, the same 12 kW system pays back in 4.7 years in Hawaii and 18.3 years in Louisiana. At the U.S. average rate of 18.31¢/kWh it takes 12.5 years. Twelve states plus D.C. still finish in under 10 years; seventeen take 15 or more. The panels do not change. The rate you are replacing does.
Last verified: October 10, 2026. Electricity rates: EIA Electric Power Monthly (July 2026, the latest state-level release). Pricing: EnergySage Marketplace (June 30, 2026). No federal credit applied — Section 25D expired December 31, 2025.
The ranking, in one picture
Same hardware, same price, same sun-hours. Only the state’s residential electricity rate changes.
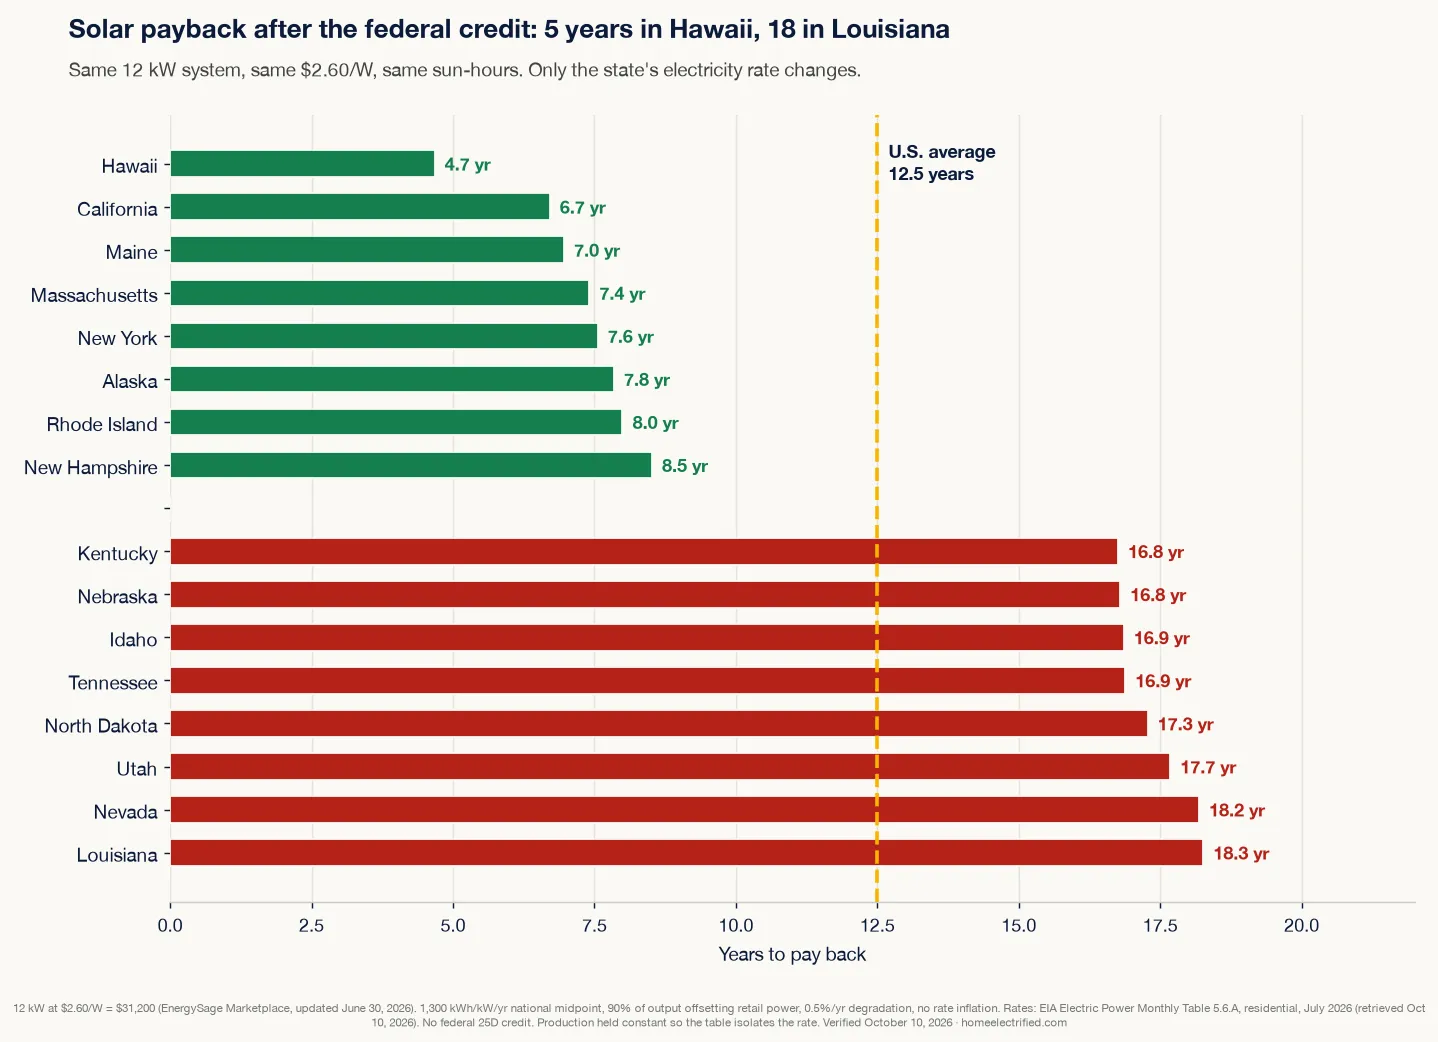
That nearly 4× spread is the whole story. Hawaii’s utility rate is 48.00¢/kWh. Louisiana’s is 12.72¢. The system costs $31,200 either place.
Payback in every state
Computed with the same model as our solar payback calculator: 12 kW at $2.60/W, 1,300 kWh per kW in year one, 90% of output offsetting a retail bill, 0.5%/year panel degradation, no rate inflation, no federal credit. Sorted fastest to slowest.
| State | Rate (¢/kWh) | Year-1 savings | Payback | 25-year net |
|---|---|---|---|---|
| Hawaii | 48.00 | $6,739 | 4.7 yr | $127,171 |
| California | 33.61 | $4,719 | 6.7 yr | $79,693 |
| Maine | 32.41 | $4,550 | 7.0 yr | $75,734 |
| Massachusetts | 30.49 | $4,281 | 7.4 yr | $69,399 |
| New York | 29.90 | $4,198 | 7.6 yr | $67,452 |
| Alaska | 28.83 | $4,048 | 7.8 yr | $63,922 |
| Rhode Island | 28.29 | $3,972 | 8.0 yr | $62,140 |
| New Hampshire | 26.60 | $3,735 | 8.5 yr | $56,564 |
| District of Columbia | 25.21 | $3,539 | 9.0 yr | $51,978 |
| New Jersey | 25.19 | $3,537 | 9.0 yr | $51,912 |
| Connecticut | 24.16 | $3,392 | 9.4 yr | $48,514 |
| Vermont | 23.75 | $3,334 | 9.6 yr | $47,161 |
| Michigan | 23.05 | $3,236 | 9.9 yr | $44,851 |
| Pennsylvania | 21.72 | $3,049 | 10.5 yr | $40,463 |
| Maryland | 21.41 | $3,006 | 10.6 yr | $39,440 |
| Ohio | 19.45 | $2,731 | 11.7 yr | $32,973 |
| Illinois | 19.22 | $2,698 | 11.9 yr | $32,214 |
| Wisconsin | 19.06 | $2,676 | 12.0 yr | $31,687 |
| Delaware | 18.48 | $2,595 | 12.4 yr | $29,773 |
| Virginia | 17.55 | $2,464 | 13.1 yr | $26,704 |
| Minnesota | 17.45 | $2,450 | 13.1 yr | $26,375 |
| Colorado | 17.00 | $2,387 | 13.5 yr | $24,890 |
| Indiana | 16.73 | $2,349 | 13.7 yr | $23,999 |
| Alabama | 16.40 | $2,303 | 14.0 yr | $22,910 |
| Georgia | 16.27 | $2,284 | 14.1 yr | $22,481 |
| Missouri | 16.09 | $2,259 | 14.3 yr | $21,887 |
| New Mexico | 16.09 | $2,259 | 14.3 yr | $21,887 |
| Iowa | 15.99 | $2,245 | 14.4 yr | $21,557 |
| Oregon | 15.97 | $2,242 | 14.4 yr | $21,491 |
| Texas | 15.88 | $2,230 | 14.5 yr | $21,194 |
| West Virginia | 15.78 | $2,216 | 14.6 yr | $20,865 |
| South Carolina | 15.47 | $2,172 | 14.9 yr | $19,842 |
| Arizona | 15.38 | $2,159 | 15.0 yr | $19,545 |
| South Dakota | 15.37 | $2,158 | 15.0 yr | $19,512 |
| Kansas | 15.27 | $2,144 | 15.1 yr | $19,182 |
| North Carolina | 15.16 | $2,128 | 15.2 yr | $18,819 |
| Florida | 15.03 | $2,110 | 15.3 yr | $18,390 |
| Montana | 14.99 | $2,105 | 15.4 yr | $18,258 |
| Washington | 14.71 | $2,065 | 15.7 yr | $17,334 |
| Mississippi | 14.54 | $2,041 | 15.9 yr | $16,773 |
| Wyoming | 14.36 | $2,016 | 16.1 yr | $16,179 |
| Oklahoma | 14.35 | $2,015 | 16.1 yr | $16,146 |
| Arkansas | 14.33 | $2,012 | 16.1 yr | $16,080 |
| Kentucky | 13.81 | $1,939 | 16.8 yr | $14,365 |
| Nebraska | 13.78 | $1,935 | 16.8 yr | $14,266 |
| Idaho | 13.73 | $1,928 | 16.9 yr | $14,101 |
| Tennessee | 13.71 | $1,925 | 16.9 yr | $14,035 |
| North Dakota | 13.41 | $1,883 | 17.3 yr | $13,045 |
| Utah | 13.12 | $1,842 | 17.7 yr | $12,088 |
| Nevada | 12.77 | $1,793 | 18.2 yr | $10,933 |
| Louisiana | 12.72 | $1,786 | 18.3 yr | $10,768 |
| U.S. Average | 18.31 | $2,571 | 12.5 yr | $29,212 |
| Indiana | 18.15 | $2,548 | 12.6 yr | $28,684 |
| Virginia | 17.61 | $2,472 | 13.0 yr | $26,902 |
| Minnesota | 16.95 | $2,380 | 13.5 yr | $24,725 |
| West Virginia | 16.80 | $2,359 | 13.7 yr | $24,230 |
| Alabama | 16.77 | $2,355 | 13.7 yr | $24,131 |
| Texas | 16.44 | $2,308 | 14.0 yr | $23,042 |
| Oregon | 16.27 | $2,284 | 14.1 yr | $22,481 |
| South Carolina | 16.18 | $2,272 | 14.2 yr | $22,184 |
| Colorado | 16.16 | $2,269 | 14.2 yr | $22,118 |
| Mississippi | 16.16 | $2,269 | 14.2 yr | $22,118 |
| Georgia | 15.84 | $2,224 | 14.5 yr | $21,062 |
| South Dakota | 15.73 | $2,208 | 14.6 yr | $20,700 |
| Arizona | 15.23 | $2,138 | 15.1 yr | $19,050 |
| Florida | 15.17 | $2,130 | 15.2 yr | $18,852 |
| Kansas | 15.13 | $2,124 | 15.2 yr | $18,720 |
| North Carolina | 15.09 | $2,119 | 15.3 yr | $18,588 |
| Kentucky | 14.98 | $2,103 | 15.4 yr | $18,225 |
| Washington | 14.95 | $2,099 | 15.4 yr | $18,126 |
| Wyoming | 14.80 | $2,078 | 15.6 yr | $17,631 |
| Montana | 14.67 | $2,060 | 15.7 yr | $17,202 |
| Tennessee | 14.47 | $2,032 | 16.0 yr | $16,542 |
| Arkansas | 14.36 | $2,016 | 16.1 yr | $16,179 |
| Louisiana | 14.15 | $1,987 | 16.3 yr | $15,487 |
| Iowa | 14.14 | $1,985 | 16.3 yr | $15,454 |
| New Mexico | 14.12 | $1,982 | 16.4 yr | $15,388 |
| Missouri | 13.68 | $1,921 | 16.9 yr | $13,936 |
| North Dakota | 13.61 | $1,911 | 17.0 yr | $13,705 |
| Nevada | 13.60 | $1,909 | 17.0 yr | $13,672 |
| Nebraska | 13.59 | $1,908 | 17.0 yr | $13,639 |
| Oklahoma | 13.38 | $1,879 | 17.3 yr | $12,946 |
| Utah | 12.96 | $1,820 | 17.9 yr | $11,560 |
| Idaho | 12.35 | $1,734 | 18.8 yr | $9,548 |
Rates are EIA July 2026 residential averages, retrieved October 10, 2026.
Arizona at 15.0 years and Nevada at 18.2 are the tell. Both have excellent sun. Both sit in the slow half of this table because their power is cheap. Rate beats sunshine.
How the number is built
Payback is not cost ÷ year-one savings. Panels lose about 0.5% of output a year, so later years save a little less. We walk year by year until cumulative bill savings cross $31,200.
Worked at the U.S. average:
- System cost = 12 kW × 1,000 W/kW × $2.60/W = $31,200
- Year-1 production = 12 × 1,300 = 15,600 kWh
- Year-1 savings = 15,600 × 90% × $0.1831 = $2,571
- Walk forward with 0.5%/year degradation → crossover at 12.5 years
- Over 25 years that is 329,940 kWh of bill-offsetting energy, so the power you bought costs 9.5¢/kWh against 18.31¢ from the utility
The 9.5¢ figure barely moves by state, because cost and output scale together when production is held constant. Your utility rate is what moves. That is the same reframe as is solar worth it in 2026 — this page is that math, for every state.
A flat $31,200 ÷ $2,571 shortcut would say 12.1 years. Degradation adds the extra third of a year. We keep it because the calculator does.
What this table does not include
Sun-hours. Production is held at 1,300 kWh per kW, the national midpoint we use across the solar pillar. Real rooftop output runs about 1,000 kWh/kW in the Pacific Northwest to about 1,800 in the desert Southwest. We do not publish a per-state sun-hours column we have not verified against a live primary source this session — NREL’s PVWatts API is not reachable from this environment, and third-party “sun hours by state” roundups are not an acceptable substitute.
That isolation is conservative for a sunny cheap-power state and ungenerous for a cloudy expensive one. The correction is large enough to matter and small enough not to reorder the table:
| If your site produces | Payback at 18.31¢ | vs the 12.5-year midpoint |
|---|---|---|
| 1,000 kWh/kW (Pacific NW) | 16.4 years | +3.9 |
| 1,300 kWh/kW (this table) | 12.5 years | — |
| 1,800 kWh/kW (desert SW) | 8.9 years | −3.6 |
Plug your address into NREL PVWatts and put the real figure in the calculator below. That single substitution is the biggest improvement you can make to any row above.
Your quote. Marketplace averages are $2.60/W. Doorstep quotes still run nearer $3.50/W — about $11,000 extra on 12 kW, worth two to three years of payback on its own. The cost breakdown covers that gap. EnergySage also publishes per-state $/W; we kept the national $2.60 so this table isolates the rate.
How you pay. These rows assume cash. A dealer-fee loan can cost more over 25 years than a lease or PPA. That comparison lives in solar lease vs buy vs PPA.
Net metering. If your utility pays less than retail for exported power, the 90% self-use assumption is the optimistic case. Check the export rate before you size.
What the expired credit changed
Until December 31, 2025, Section 25D knocked 30% off a system you owned. At the U.S. average that cut payback from 12.5 years to 8.7 — same model, $21,840 out of pocket. The credit is gone for installs completed after that date. What happened to the solar tax credit covers what still works — including the lease/PPA route that can still carry Section 48E.
A 12.5-year payback on a 25-year asset is still a positive return. It is no longer the easy yes it was in 2025.
Where the economics break
Three cases where this table should talk you out of it, not into it:
- Cheap electricity. Below about 13.5¢/kWh — Louisiana, Nevada, Utah, North Dakota — payback runs past 17 years. You are betting on rate rises, not banking savings. Idaho, Tennessee, Nebraska and Kentucky, all just under 14¢, are close behind at about 16.8–16.9 years.
- You might move within five years. Even Hawaii only returns a fraction of the system through bills in year three. Resale value is real and not guaranteed to return the full cost.
- A shaded, complex, or aging roof. Shade cuts production directly. Re-roofing later means paying to pull the array off and put it back. Do the roof first.
The 12 kW default is also the average system quoted, not the average system needed. EIA usage data says the typical home implies about 8 kW. How many solar panels do I need sizes from your bill instead.
Run your own state
Change the production number. That is the point of the editable field.
Solar Payback Calculator
Live October 2026 data: state electricity rates (EIA) and marketplace pricing (EnergySage). Every field is editable.
Assumes 0.5%/year panel degradation and no electricity-price inflation — both conservative: rising rates shorten payback, and this ignores maintenance or an inverter replacement, which lengthen it. Production varies hugely by location (roughly 1,000–1,200 kWh per kW in the Pacific Northwest and Northeast, 1,300–1,450 in the Southeast, up to ~1,800 in the desert Southwest) — run your address through NREL PVWatts and put the real figure in. Rates: EIA Electric Power Monthly (July 2026), retrieved October 10, 2026. Pricing: EnergySage Marketplace, retrieved August 2, 2026. Section 25D expired for installations completed after December 31, 2025, so no federal credit is applied. Estimates only, not a quote.
Methodology & sources
Electricity rates re-verified October 10, 2026 (pricing as dated below):
- Electricity rates: EIA Electric Power Monthly, Table 5.6.A, residential, July 2026 state-level data. Retrieved October 10, 2026. U.S. average 18.31¢/kWh (July 2025: 17.45¢).
- System pricing: EnergySage Marketplace national average $2.60/W and a 12 kW average quoted system (page updated June 30, 2026; state $/W table stamped August 14, 2026). We use the national $2.60 so the ranking isolates the rate.
- Production: 1,300 kWh per kW per year, the national midpoint used across this site (≈4.2 peak sun-hours × 365 × 0.85 derate). Real values run about 1,000 in the Pacific Northwest to 1,800 in the desert Southwest. We did not assign a per-state production number this session because we could not retrieve a live primary NREL table; use PVWatts for your address.
- Degradation: 0.5%/year linear, a standard warranty assumption, giving 23.5 full-output-equivalent years over 25.
- Payback is computed year by year with degradation, not as cost ÷ year-one savings. It excludes electricity-price inflation (which shortens payback) and excludes maintenance and any inverter replacement, typically $1,500–$3,000 around year 12–15 (which lengthens it).
- Federal credit: none applied. Section 25D expired for installations completed after December 31, 2025.
- Figures are planning estimates, not quotes, and this is not financial advice. Get three competing quotes and confirm your utility’s current net-metering terms before committing.
Rates and pricing change; this page is re-verified on a schedule and the “verified” date reflects the latest check.
Frequently asked questions
What is the average solar payback period in the US in 2026?
About 12.5 years at the U.S. average residential rate of 18.31¢/kWh, for a 12 kW system at $2.60/watt with no federal credit. It was 8.7 years while the 30% credit existed. Twelve states plus D.C. still pay back in under 10 years; seventeen take 15 or more.
Which state has the fastest solar payback?
Hawaii, at about 4.7 years. California is next at 6.7 years, then Maine at 7.0. High electricity rates do more for payback than extra sun — Hawaii's 48¢/kWh is why it wins, not its weather.
Which state has the longest solar payback?
Louisiana, at about 18.3 years, followed by Nevada at 18.2 and Utah at 17.7. Cheap power, not a lack of sun, is what stretches payback. At Louisiana's 12.72¢/kWh a typical system takes most of its warrantied life to break even.
How long do solar panels take to pay for themselves after the tax credit expired?
The expired 25D credit added just under four years at the national average — from 8.7 years to 12.5. The credit is gone for systems you buy yourself if the install finished after December 31, 2025. Leases and PPAs can still carry a federal credit through Section 48E.
Does more sun shorten solar payback as much as a high electricity rate?
No. Utility rates span nearly 4× across states (12.72¢ in Louisiana to 48¢ in Hawaii). Typical rooftop production spans about 1.8× (roughly 1,000 kWh per kW in the Pacific Northwest to 1,800 in the desert Southwest). Rate is the bigger lever; sun is the correction you should still make for your address.
Is a 12-year solar payback worth it?
It is a real return on a 25-year asset, not a fast one. You get your money back with about 13 years of production left. It is a weaker deal if you may move inside five years, your roof is shaded, or your utility pays little for exported power.