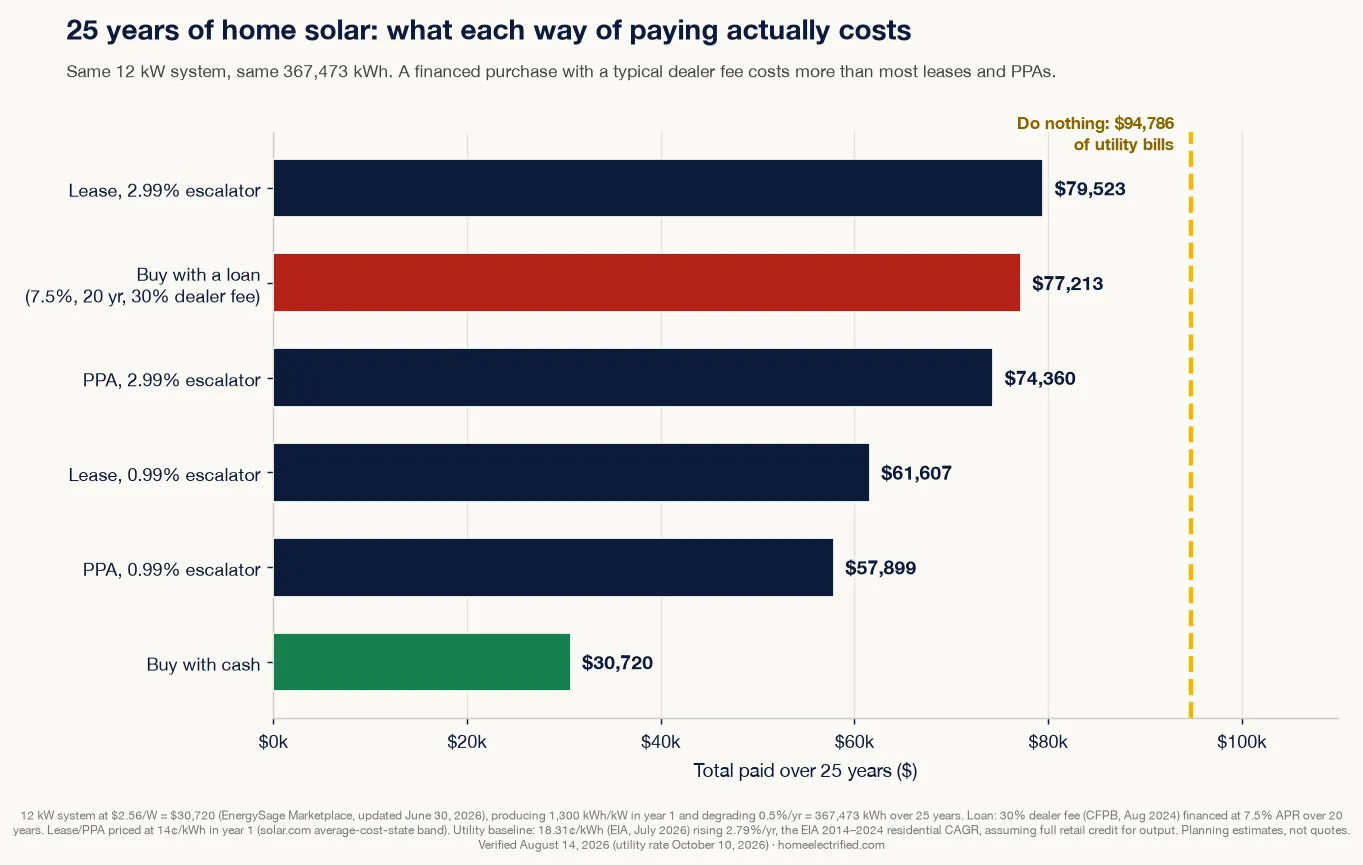
Quick answer: Paying cash is still much the cheapest way to own solar — about $30,720 over 25 years on a 12 kW system, versus $57,899–$79,523 for a lease or PPA. But most people don’t pay cash, and that’s where the usual advice breaks: a typical solar loan carrying a 30% dealer fee at 7.5% over 20 years costs about $77,213, which is more than a well-negotiated PPA. The real choice for most households isn’t lease versus buy — it’s lease versus borrow.
Last verified: August 14, 2026; utility-rate baseline refreshed October 10, 2026 (EIA, July 2026 data). System pricing: EnergySage Marketplace (June 30, 2026). Electricity rate inflation: EIA. Loan markups: CFPB. Lease/PPA terms: EnergySage and Solar.com (January–February 2026).
The four ways to pay, in one table
| Who owns it | What you pay | Federal credit | |
|---|---|---|---|
| Cash | You | Full price up front | None — 25D expired |
| Loan | You | Monthly, plus interest and a dealer fee | None — 25D expired |
| Lease | The provider | Fixed monthly rent, escalating | Provider claims 48E |
| PPA | The provider | Per kWh produced, escalating | Provider claims 48E |
A lease and a PPA are the same deal billed two different ways: someone else owns panels on your roof and sells you the output. The distinction that matters is who carries production risk — under a lease you pay the same whether the system has a great year or a bad one; under a PPA you pay only for what it actually makes. PPAs are authorized in about 29 states plus D.C.; leases are available more widely.
Both run 20–25 years, both normally include maintenance and monitoring, and both typically allow a buyout starting around year 6 — the point at which the provider has cleared the tax-recapture period on the credit it claimed.
What each option actually costs over 25 years
This is the comparison the sales conversation never puts side by side. Same 12 kW system, same 367,473 kWh of output over 25 years, four ways of paying for it:
| How you pay | Total over 25 years | Cost per kWh | Saved vs. the utility |
|---|---|---|---|
| Cash | $30,720 | 8.4¢ | $64,066 |
| PPA, 0.99% escalator | $57,899 | 15.8¢ | $36,887 |
| Lease, 0.99% escalator | $61,607 | 16.8¢ | $33,179 |
| PPA, 1.99% escalator | $65,493 | 17.8¢ | $29,293 |
| Lease, 1.99% escalator | $69,865 | 19.0¢ | $24,921 |
| PPA, 2.99% escalator | $74,360 | 20.2¢ | $20,426 |
| Loan (7.5%, 20 yr, 30% dealer fee) | $77,213 | 21.0¢ | $17,573 |
| Lease, 2.99% escalator | $79,523 | 21.6¢ | $15,263 |
| Do nothing | $94,786 | 25.8¢ avg | — |
Every option beats doing nothing. That’s the easy part, and it’s the part solar companies lead with. The interesting result is the ordering within the list: a financed purchase lands sixth out of seven. Buying beats leasing only if you buy the way most people can’t.
Why the loan does so badly
Two things stack up, and only one of them is obvious.
The obvious one is interest: $39,936 borrowed at 7.5% over 20 years costs about $322 a month, or $77,213 in total payments.
The non-obvious one is what you’re borrowing in the first place. Solar loans are routinely sold with a dealer fee — a markup the installer pays the lender to advertise a lower rate, then adds to your principal. The Consumer Financial Protection Bureau found these fees “increase the loan cost by 30% or more above the cash price,” and that lenders “frequently bake these fees into a loan’s principal without including them in the stated APR.” So the $30,720 system becomes a $39,936 loan, and you pay 7.5% on the markup for two decades.
That’s the trap in the standard advice. “Buying beats leasing” is true of cash buying. Applied to a dealer-fee loan it can be flatly wrong — here it’s about $46,493 more than paying cash, and worse than four of the six third-party options.
If a lender advertises an unusually low APR, ask for the cash price and the financed amount as two separate numbers. The gap between them is the fee, and it is negotiable in a way the interest rate is not.
The escalator is the most expensive word in the contract
Nearly every lease and PPA includes an escalator — an automatic annual increase, offered almost universally at 0.99%, 1.99%, or 2.99%. It reads like a rounding error. It isn’t.
On our 12 kW system, the same contract at 0.99% versus 2.99% is a difference of $16,461 over 25 years. Nothing else you can negotiate — not the start rate, not the term — moves that much money.
The pitch for accepting a high escalator is that utility rates climb faster, so you stay ahead. Worth checking against the actual record. From the EIA’s annual series, the U.S. average residential rate went from 12.52¢/kWh in 2014 to 16.48¢ in 2024 — a compound annual increase of 2.79%. (EnergySage independently uses 2.8% as its long-term electricity-inflation benchmark, which is a reassuring match for a number we derived separately.)
So a 2.99% escalator rises slightly faster than the long-run rate of the thing it’s supposed to protect you from:
| Year | Utility at 2.79%/yr | PPA at 0.99% | PPA at 2.99% |
|---|---|---|---|
| 1 | 18.4¢ | 14.0¢ (24% off) | 14.0¢ (24% off) |
| 10 | 23.6¢ | 15.3¢ (35% off) | 18.3¢ (23% off) |
| 25 | 35.7¢ | 17.7¢ (50% off) | 28.4¢ (20% off) |
Note what does and doesn’t happen. A 2.99% escalator does not push you above the utility rate — the 20–30% discount you sign at is too big a head start to lose in 25 years. What it does is freeze your discount at roughly where it started, while a 0.99% escalator lets that discount widen to about half off. You don’t get burned. You just stop getting better.
Two honest caveats. First, the long run isn’t the only run: over the last five years (2019–2024) residential rates rose 4.84% a year, and over the last three, 6.46%. Against that, a 2.99% escalator looks fine. Whether you take it is a bet on which era repeats. Second, none of this touches the ownership question — even the best escalator leaves a PPA costing roughly twice what cash does.
Lease vs PPA: who eats the degradation
Panels lose about 0.5% of their output per year. Over 25 years that compounds to roughly 12% less power at the end than at the start.
Under a PPA you’re buying kilowatt-hours, so your bill shrinks as production does. Under a lease you’re renting equipment, so it doesn’t. On identical terms that asymmetry is worth $3,707 to $5,163 over 25 years depending on the escalator — about $4,372 at the middle 1.99%.
It’s not a huge number next to the escalator, but it points the same direction, and it’s why a PPA is generally the better of the two when both are on the table. The exception is if your roof underperforms its estimate: a lease caps what you pay regardless, while a PPA on a shaded roof simply bills less because it produced less. Whether that’s protection or a problem depends on whether the shortfall was priced in.
Does the 30% credit actually reach you?
This is the pitch that sells third-party ownership in 2026, and it’s half true.
Section 25D — the 30% credit for systems you own — expired for installations completed after December 31, 2025. Lease and PPA providers claim the commercial 48E credit instead, which is why the industry pivoted hard: third-party ownership was about 45% of U.S. residential installations as of late 2025 and projected to grow another 25% in 2026, and Sunrun told investors that 94% of its new customers are subscribers rather than buyers.
So the credit is real. The question is how much of it lands on your side of the table. Our cost-per-kWh analysis puts a homeowner-owned system at about 9.5¢/kWh over 25 years with no credit. A provider claiming 30% is producing that same power at roughly 6.6¢/kWh — and selling it to you at 15.8¢ to 20.2¢.
To be fair about the gap: the provider is also carrying insurance, monitoring, repairs, inverter replacement, customer acquisition, and its own cost of capital, none of which a cash buyer pays a third party for. It isn’t 9¢ of profit. But “you still get the 30% credit” is not what’s happening — you get some of it, filtered through a company that has every reason to keep the rest. Treat the credit as an explanation for why TPO pricing improved in 2026, not as a benefit you can count.
Also verify which deadline your project falls under. Projects that began construction by July 4, 2026 hold a four-year safe harbor; anything starting after must be placed in service by December 31, 2027. That first date has passed, so if a salesperson invokes the credit, ask which of the two applies to your system.
The part that bites in year eight
The costs above assume you stay 25 years. Most people don’t.
An owned system transfers with the house and is done. A lease or PPA is a contract that has to go somewhere, and the mechanics are the same everywhere:
- The provider generally files a UCC-1 financing statement covering the equipment. It’s not a lien on your home, but it appears in a title search and your buyer’s lender will ask about it.
- Your buyer must be approved to assume the agreement, which normally means a credit check by the solar company. A buyer who doesn’t qualify — or simply doesn’t want a 17-year obligation attached to a house — leaves you buying out the contract at closing.
- Buyouts are usually available from around year 6, priced off the remaining payments or fair market value depending on the contract.
We looked for a reliable national figure for what buyouts actually cost and didn’t find one we’d stand behind — the numbers in circulation come from firms selling buyout services, and the contracts genuinely vary. So we’re not publishing a range. What we will say is that the buyout formula is in your contract before you sign it, it’s the clause fewest people read, and it’s the one that decides how expensive moving becomes.
If there’s a real chance you’ll sell inside ten years, this belongs in the decision at the same weight as the escalator.
So which one is right for you
Pay cash if you can. It’s not close: $30,720 versus $57,899 at best for third-party ownership. Everything below this line is a question about access to capital, not about solar.
A lease or PPA makes sense if you have little or no tax liability to offset (you weren’t going to use a credit anyway), you want zero upfront cost and no responsibility for repairs, you can get an escalator at 0.99% or flat, and you expect to stay put. Take the PPA over the lease where both are offered.
A loan makes sense if you can find one without a heavy dealer fee — a credit union HELOC or an unsecured loan priced on its own merits, rather than a point-of-sale product bundled into the quote. That version of “buying” beats leasing comfortably. The bundled version often doesn’t.
Nothing makes sense if your utility rate is low. All of these options are priced against what you’d otherwise pay the utility, so in a cheap-power state the discount that makes a PPA attractive barely exists — and buying outright takes about 18 years to pay back. Our solar payback calculator will tell you where your state lands in about thirty seconds, and what a system costs before financing is the number every option above is built on.
Methodology & sources
Verified August 14, 2026:
- System and production: 12 kW at $2.56/W = $30,720, the national average quoted system on the EnergySage Marketplace (updated June 30, 2026). That’s the average system quoted; on EIA usage data the average home only needs about 8 kW, which how many solar panels do I need works through. Every total below scales roughly with system size. Output of 1,300 kWh per kW in year one, degrading 0.5%/year, gives 367,473 kWh over 25 years. These are the same figures used across our solar cost and payback pages.
- Electricity rate and inflation: 18.31¢/kWh U.S. average residential (EIA Electric Power Monthly, Table 5.6.A, July 2026 data, re-checked October 10, 2026). The 2.79%/year long-run escalation is our own CAGR calculation on the EIA Electric Power Annual residential series, 12.52¢ (2014) to 16.48¢ (2024); the 4.84% and 6.46% figures are the 2019–2024 and 2021–2024 CAGRs from the same table.
- Loan terms: 7.5% APR over 20 years, EnergySage’s stated example rate (May 2026), against a typical 6–12% range. The 30% markup is the CFPB’s finding that dealer fees “increase the loan cost by 30% or more above the cash price” (report published August 7, 2024 — it predates the credit’s expiry, and we found no more recent federal measurement).
- Lease/PPA terms: escalators of 0.99%, 1.99% and 2.99%, and 20–25 year terms, confirmed independently by EnergySage (February 19, 2026) and Solar.com (January 22, 2026). PPA rate bands of 8–12¢ / 12–17¢ / 17–28¢ by state electricity cost, and the 20–30%-below-utility benchmark, from Solar.com (January 8, 2026). We model a 14¢/kWh start — the midpoint of the average-cost band, about 24% below the U.S. average rate. Your quote will differ; the rate is priced off your utility, not off the hardware.
- Market share: third-party ownership at 45% of residential installations, projected 25% growth in 2026, and Sunrun’s 94% subscriber figure, from Utility Dive (September 4, 2025).
- 48E deadlines: construction start by July 4, 2026 earns a four-year safe harbor; later starts must be placed in service by December 31, 2027. Consistent with our solar tax credit page.
- What we deliberately left out: we found no source we trust for typical lease buyout amounts or for how much longer homes with leased systems take to sell. The figures circulating online trace to companies selling buyout and cancellation services. Rather than repeat them, we’ve described the mechanism and left the numbers out.
- Assumptions and limits: the utility baseline assumes you use or receive full retail credit for everything the system produces. Where export rates are below retail, every option’s savings shrink together, so the ranking holds while the absolute numbers fall. We ignore maintenance and inverter replacement for the owned cases (which favors owning) and any state credit, SREC or rebate (which also favors owning). No discounting is applied to future dollars.
- Figures are planning estimates, not quotes. Get three competing offers, and ask each for the cash price, the financed amount, and the escalator as three separate numbers.
Solar financing terms and incentives change frequently; this page is re-verified on a schedule and the “verified” date reflects the latest check.
Frequently asked questions
Is it better to lease or buy solar panels in 2026?
Buying with cash is far cheaper — about $30,720 over 25 years versus $57,899 to $79,523 for a lease or PPA on the same 12 kW system. But if you finance the purchase, the gap closes and can reverse: a typical solar loan with a 30% dealer fee at 7.5% over 20 years costs about $77,213, more than a well-negotiated PPA.
What is the difference between a solar lease and a PPA?
A lease charges a fixed monthly payment no matter how much power the system makes. A PPA charges you per kilowatt-hour actually produced. Because panels lose about 0.5% of their output each year, a PPA bill shrinks slightly as the system ages while a lease payment does not — worth roughly $4,400 over 25 years on a typical system.
Do I still get the 30% federal solar tax credit with a lease or PPA?
Not directly. Section 25D expired for homeowner-owned systems after December 31, 2025. Lease and PPA providers claim the commercial 48E credit instead and price some of it into your rate. On our model the credit cuts a provider's cost to roughly 6.6¢/kWh while a PPA charges 15.8–20.2¢/kWh, so you see part of it, not all of it.
What is a good solar PPA escalator?
The lower the better — 0% or 0.99% if you can get it. Providers typically offer 0.99%, 1.99%, or 2.99%. On a 12 kW system, moving from a 0.99% to a 2.99% escalator costs about $16,461 over 25 years, which makes it the single most expensive number in the contract.
Does a solar lease make it harder to sell your house?
It adds a step. The provider usually files a UCC-1 financing statement against the equipment, and your buyer must either be approved to assume the contract — providers commonly run a credit check — or you buy it out at closing. Owned systems transfer with the house and carry no such condition.
How much do solar PPA rates cost per kWh?
Roughly 8–12¢/kWh in cheap-electricity states, 12–17¢ in average-cost states, and 17–28¢ in expensive ones, because PPA rates are priced off your local utility rate rather than off the cost of the hardware. A rate 20–30% below what your utility charges is the usual benchmark for a competitive offer.